The Schedule Behind Startup Growth


The holy grail of venture capital investing is simple to say and hard to do:
Find a company that can reach $100M in Annual Recurring Revenue (ARR) and invest early enough to matter.
Not because $100M is a magic number by itself, but because ARR, when it’s high-quality and durable, can translate into a company with a $1B+ valuation, producing the unicorn outcome every venture investor wants.
And now we’re in a new era where a small number of startups are pushing toward trillion-dollar outcomes, a different class of scale entirely. These companies have been called Chimeras by some VCs. They are once-in-a-generation businesses that don’t just become unicorns, but evolve into something bigger. They become platforms so dominant and durable they begin to feel like economic infrastructure. Whether you’re hunting Unicorns or Chimeras, the mission is the same: to back great founders building something that can compound. But this begs some questions:
How do you know whether a company can actually reach $100M ARR from where it is today?
How do you tell the difference between a company with a real path to venture scale and a company with a compelling narrative and a good quarter?
You don’t start with hope. You start with the schedule showing the compounding path a company must survive, in real multiples, over real time.
But before we talk about talent, vision, and market narratives, we need to talk about Growth Math. Because growth talk can be cheap, Growth Math is not.
Growth Math Isn’t a Story. It’s a Schedule.
Most startup decks treat growth like a vibe. They show upward curves, big markets, confident assumptions, and the familiar line “Here’s where we’re going.”
But venture outcomes aren’t driven by confidence. They’re driven by compounding, and compounding has rules. One framework that shows up often in venture conversations about growth is the triple-triple-double-double-double model, commonly called TTDDD.
TTDDD: The Five-Year Growth Profile
The TTDDD model describes a company that:
- Triples in Year 1
- Triples in Year 2
- Doubles in Year 3
- Doubles in Year 4
- Doubles in Year 5
It’s popular because it’s memorable. It gives people a clean mental picture of “elite growth.” But the real value of TTDDD isn’t in repeating it. The value is in translating it into what it actually implies.
TTDDD in Multiples: No Hype, Just Multiplication
Let’s do the part most decks quietly avoid. If a company triples, triples, then doubles three times, the total growth multiple is:
3 x 3 x 2 x 2 x 2 = 72
So TTDDD implies 72× growth over five years. That’s not a motivational quote. That’s a compounding schedule. And once you see it that way, you can stop debating opinions and start asking better questions.
Exit Velocity: What Starting ARR Gets You to $100M?
If $100M ARR is the target, and TTDDD implies 72× growth, then we can back into the starting ARR required to hit the outcome:
$100M ÷ 72 ≈ $1.4M
So the math says:
Under TTDDD assumptions, a company needs to be around $1.4M ARR to reach $100M ARR within five years.
This is why early traction matters, but not in the way people usually frame it. The point isn’t to celebrate revenue as a badge. The point is to understand whether the company is approaching exit velocity, the zone where the growth trajectory can plausibly compound into venture-scale outcomes.
Why Investors Should Think in Doublings (Not Percentages)
Percent growth sounds impressive. It’s also easy to misunderstand. Multiples are harder to fake, and doublings are the cleanest multiple of all. A doubling is simple:
- 1 doubling → 2×
- 2 doublings → 4×
- 3 doublings → 8×
- 7 doublings → 128×
- 10 doublings → 1,024×
This is why savy investors should translate everything into doublings. Because once you’re thinking in doublings, the pitch gets quieter and the truth gets louder.
Consider a company that goes from $100K ARR to $100M ARR, that’s roughly:
$100M ÷ $100K = 1,000× increase
or
≈ $2^{10}$
That’s about 10 doublings. Ten!
Not “a good year.”
Not “momentum.”
That is ten full repetitions of “we figured it out and did it again.”
Doubling Isn’t Just Revenue. It’s a Business Model Replication Test.
So what needs to be figured out? When investors talk about growth, they aren’t only describing a revenue milestone. They’re asking a deeper question: Can this business replicate itself under higher load?
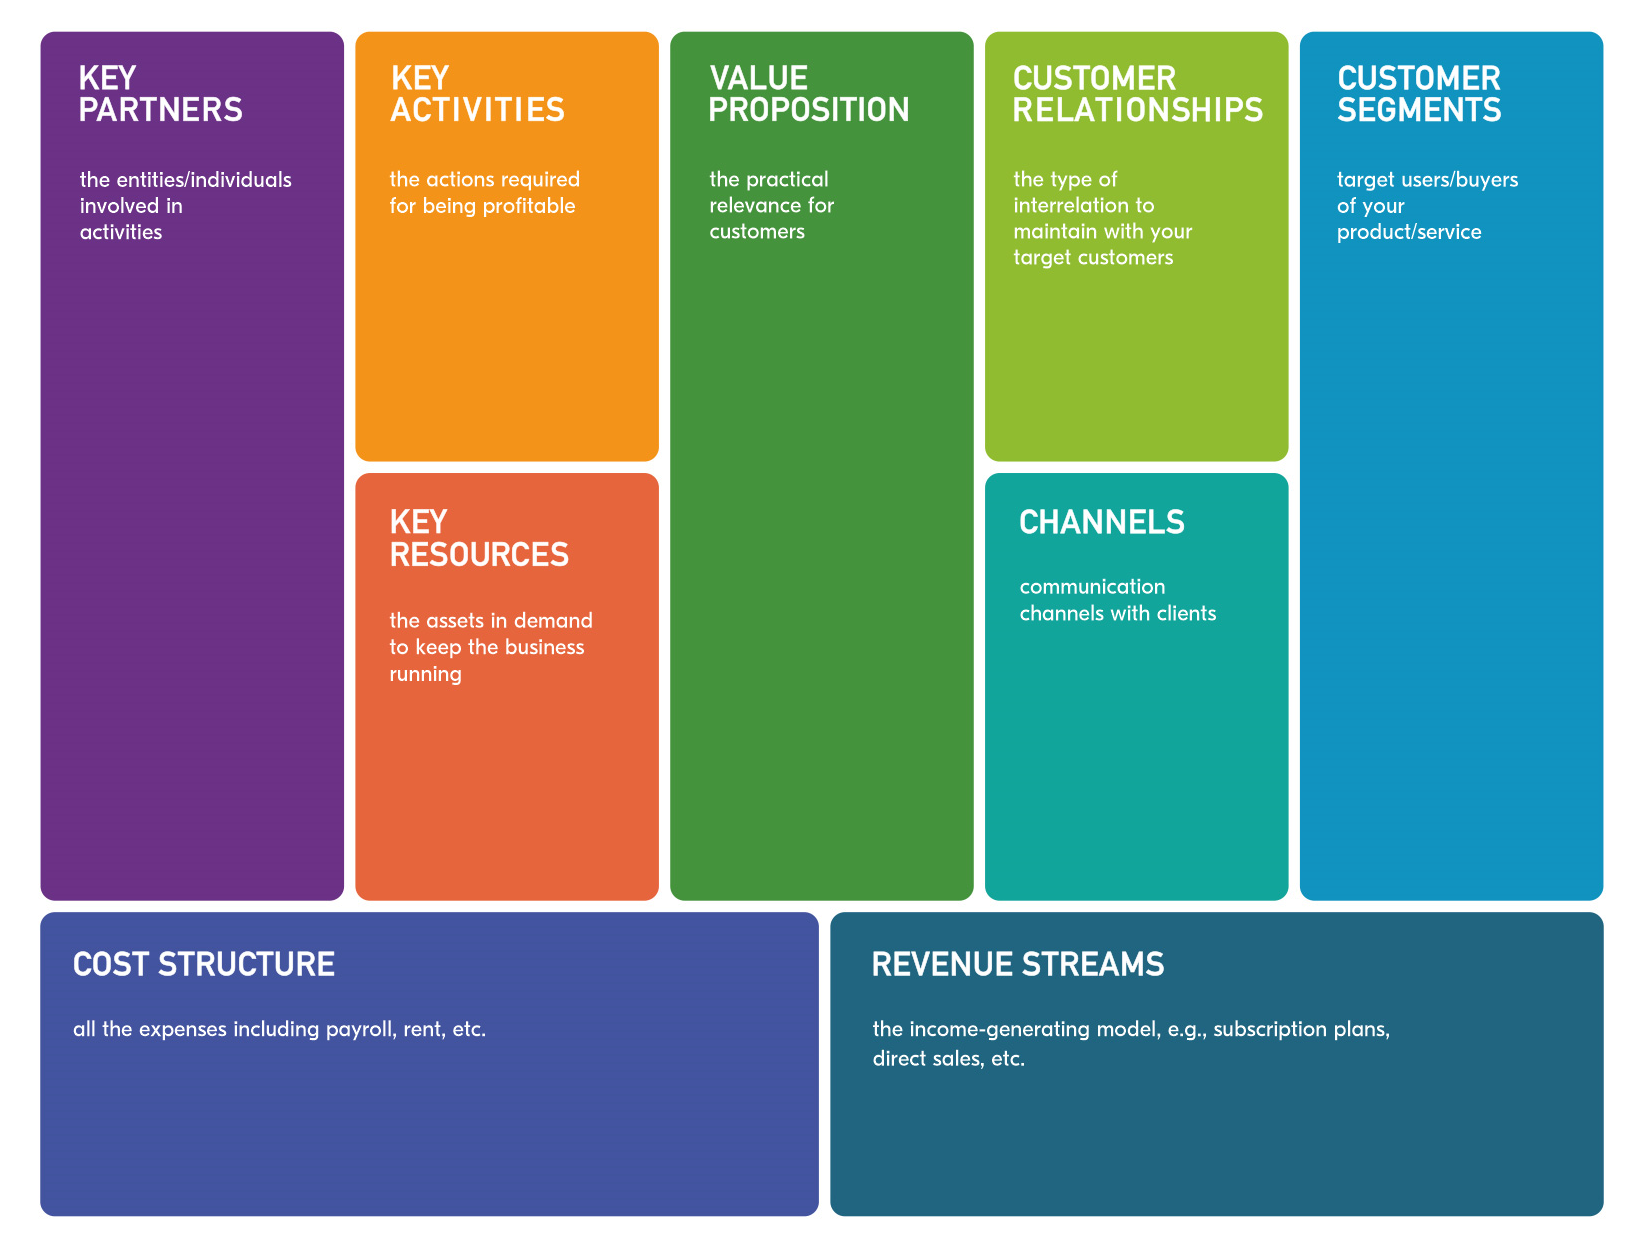
The Business Model Canvas (BMC) is a great way to engage this question. The BMC defines a business as a system of nine interdependent components working together.
https://railsware.com/blog/business-model-canvas/
- Customer Segments
- Value Propositions
- Channels
- Customer Relationships
- Revenue Streams
- Key Resources
- Key Activities
- Key Partnerships
- Cost Structure
(More detail provided in a later article.)
So the TTDDD schedule is not only claiming the revenue can compound. It is claiming that the business model can scale. That means the customer acquisition, delivery engine, partnerships, costs, and customer experience won’t collapse while the company grows. A startup can triple once on momentum. But to triple or double repeatedly, the business model must behave like something repeatable. That’s why doubling math matters because it forces clarity. Because every doubling demands that the business keeps working as the load increases.
The Small Detail That Changes Everything: MoM vs YoY
Now here’s where things get slippery. You’ll hear founders say things like:
“We’re growing 30%.”
That sentence means almost nothing until you ask the follow-up question:
30% month-over-month or 30% year-over-year?
Because those are not in the same universe (a little dramatic, perhaps).
- 30% YoY growth is strong, healthy, and believable.
- 30% MoM growth is explosive—and typically short-lived.
To appreciate the difference, you don’t need to be a mathematician. You just need to understand compounding. If a company grows 30% month-over-month, the monthly growth multiplier is:
1 + 0.30 = 1.3
Compounded over 12 months, thats:
1.3¹² ≈ 23×,
where 1.3 represents 30% growth, repeated 12 times over one year, which equals a 23x growth multiple. That is ~2,200% + annual growth rate.
There are two ways of expressing this outcome:
- 23× growth multiple means the company ends the year at ~23 times its starting size
- 2,200% growth rate means the increase is ~22× on top of the original base,
…but I digress.
So when someone says “30% growth,” the right response isn’t excitement. The right response is to seek clarity by asking:
“From what base?”
“Over how many months?”
“And what did it cost you?”
Because early-stage growth rates can look insane simply because the starting number is small.
For example, $1,000/month to $1,300/month is 30%. That’s real progress, but it’s not a breakout. Real breakout growth shows up when the rate holds as the base gets bigger; When the numbers are heavier but the engine can still pull the weight. So don’t just ask about growth. Ask about the quality of growth:
“Are customers staying, or churning out?”
“Is revenue real, or bought through discounts and ads?”
“Does the business acquire customers profitably (CAC vs LTV)?”
“How fast do you earn back what you spent (payback period)?”
“Can the product, team, and operations sustain this pace?”
Because the goal isn’t to touch 30% growth once. The goal is to build a system that can repeat it without breaking the company. That’s the difference between a spike and a business.
The Hidden Assumption Behind Every Aggressive Growth Plan
Here’s what most growth projections quietly assume:
We will keep doubling while the company stays stable.
But compounding doesn’t just increase revenue. It increases pressure. Every doubling is a new level of customers, expectations, complexity, hiring, and coordination. Growth is never just acceleration, t’s transformation. That’s why the math is useful. It doesn’t predict the future perfectly. It does something better: It reveals what must be true for the outcome to be possible. TTDDD isn’t a forecast. It’s a claim. A claim about:
- repeatability
- time compression
- operational evolution
- constraint management
- survivability under speed
The numbers don’t care how inspiring the pitch is. The math tells the truth. And that’s the point.
Startup growth math isn’t about impressing anyone. It’s about forcing honesty. It gives founders and investors a shared language to ask better questions early, before hype turns into heartbreak. For example:
“How many doublings are required to reach the target?”
“How fast must those doublings happen?”
“What starting base makes that path plausible?”
“Are we looking at sustainable compounding or temporary early momentum?”
Because in the end, you can’t negotiate with the curve. You can only build a business strong enough to live inside it.
What Comes Next
This article is the clean part. The math is orderly. The spreadsheet behaves, but the real world doesn’t. The real question is What happens inside a company every time it doubles? That’s where most growth plans meet reality.
In the next article, we’ll move beyond the numbers and into the operating truth of how startups evolve as they scale, why growth slows even in strong companies, and what founders, and VCs, must pay attention to if they want to change fast without breaking. The math tells you what the outcome requires, while the company tells you whether it can survive the process.